
Jean-Pierre BERDOT
Professor at the University of Poitiers,
Professor of Honour of the “Al. I. Cuza” University of Iasi
Abstract. This study intends to verify if, on the stock markets of the Euro zone, the integration as a process that lead to their unification is applied, even if several disparities exist among the national characteristics of the return-risk. We verify the pertinence of the consideration of third and fourth order moments in the comprehension of the arbitration mechanisms.
The first part focuses on establishing the situation of the integration of the stock markets from the Euro zone member countries on the basis of the main characteristics of the returns and the associated risk premiums. Starting with the apparent inadequacy in the traditional theory, the second part considers the usual responses to the main questions posed on the empirical plan: non-normality of the returns distributions and non-quadratic preferences of the investors. The third part solves the apparent contradiction among the risk’s characteristics and price, on one side, and the stronger and stronger correlations among the national markets and the European indexes, on the other side.
On the financial markets, the strategic variable is not the stocks’ price or the stock market indexes prices, but the growth rate of this price. This rate measures the gains in capital made by the investors and can be thought of as the return rate (except of the payment of dividends) of stocks or portfolios. This return rate calculated as
(where Pt represents the assets price at the market closing moment t) presents an interest both for the statistician and the investor:
1. It influences the investors’ opportunities and strategy.
2. Its statistical attributes (empirical as well as theoretical) are more suitable for treatment than a price series: moreover, the returns are stationary which makes the estimation and prediction easier.
Traditionally, the financial analysis concerns the arbitration among the risky financial assets on the basis of the couple return-volatility, appreciated through the first two moments of their returns distribution: mean and standard deviation. Indicators such as Sharpe’s ratio1 synthesize a priori this double dimension of the arbitration.
However, for a long time, the questions on the quality of the information gathered by this type of indicator have multiplied. Indeed, except of considering the normal distributions, the characteristics of the statistical series distributions can not be summarized only by their two first moments. But, the returns’ rates of the financial assets are generally non-normal. Consequently, it is not surprising to notice that the researches in finance are interested in the characteristics of the (centred) moments of higher order, namely of third order (skewness) and of fourth order (kurtosis).
This study intends to verify the pertinence of considering third and fourth order (centred) moments in understanding the arbitration mechanisms among the directional financial assets (in connection to the benchmarks that are the market indexes). More precisely, starting from the characteristics of the national “flagship indexes” for the Euro zone, we examine the nature of the financial markets’ integration of the states that became members of the Euro zone from 1999.
The first part of the study recalls the principle of the rational investors’ choice on the financial markets and the role that the returns distribution moments may play. It sets up the description of the integration of the stock markets of the Euro zone member states on the basis of the empirical characteristics (including the first four moments) of the returns’ rates of the market indexes.
The second part explains the contribution of the traditional theories centred on the first two moments (mean and variance). It raises a contradiction, on the stock markets of the Euro zone, between the maintenance of significant differentials of the risk’s characteristics and price (traditional sign of non-integration), on one side, and the stronger and stronger correlations between national markets and European indexes, on the other side (sign of integration).
The third part starts from the apparent inadequacy of the traditional theory and gives relevant answers to the main two questions raised on the empirical plan: the non-normality of the returns’ distributions and the non-quadratic preferences of the investors. It shows that, despite the apparent disparities of all the returns characteristics associated to the national stock markets indexes of the Euro zone (means, standard deviations, Sharpe’s ratios), the integration process is at work. The apparent differentials of the price of the risk are expressing a rational evaluation of the risk associated to the moments of orders higher than 2, and especially of the major risks associated to the negativity of the skewness. The investor asks for a premium in order to compensate the high probability of extreme losses.
The main stock markets of the Euro zone are kept by their flagship indexes: Germany (DAX30 written as ALL), Austria (ATX written as AUT), Belgium (BEL20 written as BEL), Spain (IBEX35 written as ESP), France (CAC40 written as FRA), Ireland (ISEQ20 written as IRL), Italy (MIB30 written as ITA), Netherlands (AEX written as PB), and Portugal (PSI20 written as POR).
Two European indexes have been kept too: EUROSTOXX50 (flagship index written as E50) and EUROSTOXX500 (wide index of the European market written as E5000).
The estimation period starts on January 1st, 1996 and ends on December 31st, 2006 (except of the Ireland for which the data are available beginning with January 1st, 1998). The data are daily data. The returns are measured by the single daily variation of the indexes prices expressed in percentages.
The risk premium associated to these returns is expressed by the difference between the daily returns and the returns rates of the German state for 10 years.
All the data come from the Datastream database.
I. The financial choices in a risky universe: the articulation between the returns rates moments and the investors’ preferences
The returns rates of stocks, portfolios, or market indexes should be considered as random variables. Indeed, it is possible to consider that the investment in Treasury bonds issued by countries such as Germany or France is safe due to the sovereign debt of such states. The investor can consider that the return rate of his placement is risk-free. It is not the same situation with the stock investments. Indeed, the future evolution of the stock prices can not be known with certainty as it is submitted to the markets hazard.
The traditional assumption is that the investors’ universe is a risky universe. In such a universe, the choice criterion is the one defined by Von Neumann and Morgenstern (1944) that is the maximisation of the expected utility.
The investors’ preferences can be expressed by a utility function that depends only on the considered asset or portfolio’s return rate R, and written therefore as U(R), with U’(R)>0.
Since the return rate is random, the utility U(R) becomes a random variable. The investor’s strategy guides him to maximize his expected utility. It is not always useful to give the utility function a specific form. It is enough to develop this function by a Taylor series about the return mean E(R), supposed m. In order to simplify, we can write the centred variable of the return as: = R – E(R) = R – m.
For reasons that will become obvious later on, the utility function will be expanded to the fourth order. When U’, U’’, U’’’, and U’’’’ represent the first, second, third and, respectively, fourth order derivatives of the utility, we have in that case:

Then, it is necessary to calculate the expected utility function.
![]()
Arranging, we obtain:
![]()
The expression obtained may be reinterpreted, as it is integrates the various expectations linked with the centred variable of the returns. We remember that the theoretical centred moment (about the mean) of a random variable R is defined by. Moreover, the mean of the centred variable is null:
E() = E((R – m)) = E(R) – m = 0.
Therefore, it is possible to express the expected utility considering the theoretical centred moments:
(1) ![]()
The expression of the expected utility makes possible to infer the strategic criteria of the investors’ choice, considering their preferences revealed by the characteristics of the returns distribution function. The expected utility is the function of, on the one hand, the returns rates moments: the mean and the 2nd, 3rd and 4th order moments and, on the other hand, the utility function form (especially of the 2nd, 3rd and 4th derivates), that is the investors’ preferences.
For the Euro zone, during the period 1996-2006, the characteristics of the daily return rates for all the analysed indexes are presented in the Table 1.
Table 1: Characteristics of the Euro zone daily return rates (1996-2006)

II. The evaluation of the indexes performance starting from the first two single moments
II.1. The first two moments as the evaluation of the performance or the mean-standard deviation criterion
The financial theory beginning with Markowitz (1952, 1959) and Tobin (1958) emphasizes the simplified Mean-Variance criterion. The consideration of the risk aversion leads to that the expected utility depends positively of the expected return and negatively of the return rates variance (the 2nd order centred moment). In other words, the expected utility should take into account this second moment:
In order to get an inverse relationship between the expected utility and the variance, it is necessary for the 2nd derivative of the utility to be negative: U’’(E(R)) < 0. This implies that the utility function is concave that is the marginal utility of the return should be decreasing.
The mean-variance criterion implies the appeal to two alternative hypotheses: either the utility function is quadratic, either the returns are normal.
II.1.1. The hypothesis of the quadratic utility function
The particular case usually retained is the one of the quadratic function that is
![]()
This function has the advantage to allow the passage from the Von Neumann and Morgenstern criterion (the maximization of the expected utility) to the Mean-Variance simplified criterion. Indeed, since
![]()
we can infer that:
![]()
The expected utility E(U(R)) can be expressed by the mean E(R) and the variance V(R), or the standard deviation, since
![]()
II.1.2. The hypothesis of normality of the returns
A quadratic utility function avoids making assumptions on the nature of the return rates. Indeed, since the return rate R follows the Normal law, its distribution is perfectly characterized by its two first moments, so that the expected utility criterion coincides with the mean-variance criterion.
Indeed, for a normal centred law, all the odd moments are null, whereas the even moments can be inferred through the variance. Thus, knowing the mean and the standard-deviation is enough for the definition of a normal variable. Moreover, the expected utility (1) becomes:
![]()
In the line with the evaluation model of the financial assets, known in the Anglo-Saxon literature under the title of CAPM (Capital Asset Pricing Model), the arbitration between average return (or risk premium) and variance (or rather standard-deviation) allows defining a ratio, known as the Sharpe’s ratio (1966, 1999), that is the criterion for portfolio’s performance and the price of the risk.
The theoretical Sharpe’s ratio associated to the return Ri, return of an index or portfolio i, is defined as
![]()
where r measures the rate without risk. This ratio is calculated as the ratio between the risk premium of an asset or portfolio i (measured by the difference between the expected return and the safe rate r) and the risk of the asset or the portfolio (measured by its standard deviation). The premium risk pays normally the risk assumed by the investor when he renounces at his portfolio in safe assets.
II.2. The first two moments as evaluation of Euro zone indexes’ performance and integration
II.2.1. The disparity of the characteristics during the period 1996-2006, as a sign of non integration of the markets
The Table 1 certifies that the apparent characteristics of the national and European markets indexes show a strong heterogeneity: this heterogeneity marks not only the expected returns but also the standard deviations, and this despite the fact that the average returns and the risk premia are always positive.
Then, we notice that the Sharpe’s ratios associated to the different indexes are considerably heterogeneous. The Sharpe’s ratio can be interpreted in two different manners: firstly, as a performance indicator, and secondly, as a measure of the price of the risk.
As a performance criterion, the Sharpe’s ratio indicates that the Austrian market is the most competitive, whereas the market of Netherlands is the least competitive. But the Sharpe’s ratio may also be considered as an indicator of the price of the risk that is in the way in which the risk premium related to a portfolio remunerates the risk of this portfolio. In this case, considered as indicators of the prices of risk on the various markets, the ratios put forward the non- realization of the single price law of the risk, or the absence of a perfect integration of the Euro zone stock markets.
II.2.2. The absence of the convergence of the Sharpe’s ratios: sign of the markets’ non-integration
But the Sharpe’s ratios have been calculated for the entire period 1996-2006. Determined for the entire estimation period, these results could give a distorted image for a convergence phenomenon that points out a dynamic process. In order to verify this possible convergence criterion, it is advisable to measure, for each year, the different Sharpe’s ratios.
The examination of the Sharpe’s ratios presented in the Table 2, for each year, allows us to reach two conclusions.
Table 2: The Sharpe’s ratios for the Euro zone indexes (1996-2006)


Figure 1: Ratios de sharpe (indices nationaux 1996-2006)
Firstly, it appears that the Sharpe’s ratios have fluctuated especially during the stock boom at the beginning of the 2000’s, during which the risk premia have been negative: this means that the average return of the stock markets have been inferior to the safe return realized on the German Treasury bonds.
Then, at the very end of the period, in 2006, even if the risk premium and therefore the Sharpe’s ratio became positive, the ratios are still characterized by a strong heterogeneity. The evolution during these years of the annual Sharpe’s ratios show that, in fact, there was not a real convergence process (see Figure 1): the dynamics observed is not the one of a regular progress towards the formation of a unique price of the risk within the Euro zone.
We notice that, if there is convergence, this one cannot be captured in terms of Sharpe’s ratios convergence.
II.2.3. The convergent dynamics of the R2 from the market model: sign of the integration of markets
But, the integration process of the stock markets may be estimated in two ways: either in terms of trend towards the formation of a single price for the risk (it is what the dynamics of the Sharpe’s ratios was supposed to express), or in terms of stronger and stronger correlations between the risk premia of the national markets and the risk premium of the European market as a whole.
For each market i of the Euro zone, we estimated for the daily data, by year, models that explain the national risk premium by the risk premium for Eurostoxx500 (written RM).
We started from the explanation of a market model (alternative version of CAPM) with constant:
![]()
Each time, it appeared that the model constant ![]()
was not significant, so that the estimations lead to the classical CAPM. Therefore:
![]()
Here, we are interested only in time behaviour of the obtained determination coefficients (see Table 3 and Figure 2). Indeed, R Squared measures the part of the total risk of an index i that is explained by the systematic risk of the market.
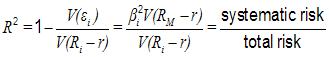
More the R Squared is closer to 1, and the portfolio of the national index i is more diversified, more its specific risk is low and more the national market is integrated.
Table 3: The annual R2 between the Euro zone indexes and the market index (1996-2006)

The growth of the majority of the determination coefficients starting with the coefficients of the most important financial markets shows that the systematic risk of the market (represented here by the Euro zone market) explains an increasing part of the risks due to the national markets. It even clearly appears a “convergence club” grouping the following markets: France, Germany, Netherlands, Italy, Spain and Belgium.
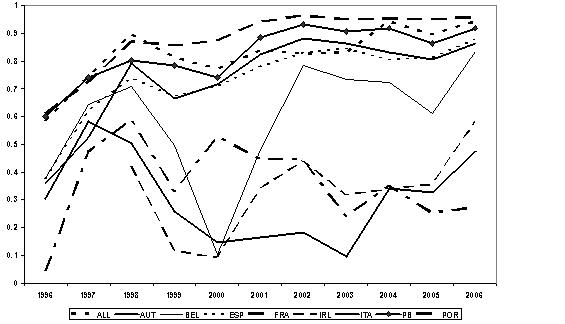
Figure 2 : Coefficients de determination (MEDAF nationaux 1996-2006)
These results, favourable to the integration hypothesis, are a priori in contradiction with the results previously obtained on the basis of the Sharpe’s ratios heterogeneity. But then, is it possible however to merge the integration process taking place in the Euro zone with the maintenance of the differences in the price of the risks? Or, is it possible to explain the heterogeneity of the Sharpe’s ratios starting from a hypothesis of markets’ efficiency and of investors’ rationality?
The noticed heterogeneity may come from the consideration by the investors of the risks included in the information offered by the 3rd and 4th (centred) moments.
III. The evaluation of the indexes’ performance considering moments of an order higher than 2
III.1. The deficiencies of the double criterion mean-variance
When identifying risk by volatility, the classical theory assimilates Sharpe’s theory on the price of the risk. Consequently, this theory founds the arbitration process exclusively on the consideration of the couple made of the two first moments: mean and standard deviation of the returns. As we saw, this approach is implicitly founded on two alternative hypotheses: either the returns are normal, or the utility functions of the investors adverse to risk are quadratic.
However, both of the hypotheses cannot be validated empirically.
III.1.1 The rejection of the hypothesis of normality of return rates
III.1.1.1. The 3rd and 4th ordered moments, the skewness and the kurtosis
The non-normality of the returns and the premium risk is a general phenomenon that can be easily confirmed in the case of Euro zone stock markets. For this, it is enough to calculate the 3rd and 4th order centred moments of the return rates distribution, or more precisely, to calculate the standardized centred moments.
The 3rd order centred moment allows defining the skewness coefficient that is the ratio between the centred moment µ3, and the standard deviation at power three, ![]() .
.
The 4th order centred moment allows defining the kurtosis coefficient that is the ratio between the µ4 and the standard deviation at power four: ![]() .
.
III.1.1.2. The skewness and the kurtosis of the return rates in the Euro zone
The estimations of the two coefficients (skewness and kurtosis) are presented in Table 1. At first sight, the skewness coefficients are all negative, except for the Netherlands. In other words, the return rates are right tailed: the highly negative returns (very important losses) are frequent on the European stock markets. Above all, it appears that the return rates for all the observed stock indexes present a very important kurtosis: the return rates are highly leptokurtic.
This phenomenon is essential for understanding the investors’ behaviour. Indeed, a leptokurtic variable is characterized by a distribution with fat tails. This means that the extreme values (negative or positive) of the distribution are more frequent than the “normal”. In the case of the return rates, it shows that the investor exposes himself frequently to very important losses, even if, in compensation, he can benefit, with the same frequency, from important gains.
III.1.1.3. Tests of the return rates non-normality
The single analysis of the two coefficients is not sufficient to reject the hypothesis of normality of returns. This hypothesis must be verified in a rigorous way.
The best normality test is a global test (both of the skewness and kurtosis), the Jarque-Bera test (1980). It is based on the JB statistics that is expressed by
![]()
The variable JB under the null hypothesis of normality H0 is a Chi Square with 2 degrees of freedom: ![]() . We accept the normality hypothesis if the variable JB is inferior to the threshold value 5.99.
. We accept the normality hypothesis if the variable JB is inferior to the threshold value 5.99.
The Table 1 for all the return rates of the Euro zone presents the JB statistics and its probability. If this probability is higher than 5%, we accept the hypothesis of normality H0.
For all cases, the probability is null, as the JB value is very high: the return rates, on the European stock markets on the whole, are not normal.
III.1.2. The rejection of the quadratic utility function
The first hypothesis (the normality of return rates) judging on the basis of the mean-standard deviation criterion is not validated.
It remains to confirm if the second hypothesis (the quadratic nature of the investors’ utility function) may be verified. The behavioural analyses traditionally lead to rejecting this second hypothesis.
Indeed, the economic agents’ behaviour and, particularly, the investors’ behaviour show, in a systematic way, the preference for odd moments (mean and skewness) and also an aversion for the even moments (standard deviation and kurtosis). The investors’ revealed preference is highlighted either by the behavioural experiences or by noticing the market’s irregularities.
III.1.2.1. The revealed behaviour towards the moments with order higher than 2
Concerning the behavioural analysis, by way of example, we can refer to two lotteries: in the first one, for 1 Euro, the player has one chance in a million to win 1 million Euros; in the second, the payer wins in all situations 1 Euro, but he has one chance out of a million to pay 1 million Euros.
Both of the lotteries have the same expected gain (equal to 0), the same variance (999,999) and the same kurtosis (999,998). But they are different in their skewness. In the first case, the skewness is positive (999.9985) while it is negative in the second case (-999.9985). Consequently, the players will normally show a preference towards the first lottery.
III.1.2.2. The irregularities of the market and the moments of an order higher than 2
Concerning the market’s irregularities, the investors’ aversion to a negative skewness1 may be expressed by two examples:
- On one side, there is an overestimation of the puts matched with an implicit high volatility of their subjected variables: they allow limiting the excessive losses and reducing thus the negativity of the skewness of the subjected variables.
- On the other side, the stocks overestimation manifests itself by abnormal high levels of the PER (price earning ratio), expressing the existence of a strong potential to increase: this overestimation remunerates the positivity of the skewness.
III.2. The role of the first four moments
In situations of non-normality, the investors’ strategies must be more logically based on the optimisation of a global criterion linking the first four moments of the return distribution. Traditionally, this criterion corresponds to the maximisation of the expected utility in a risky future.
We find the general rule of the equation (1) that we can express on the basis of skewness (SK) and kurtosis (KU).
![]()
The investors’ revealed preferences show that the utility is an increasing function of the 1st and 3rd order moments, and decreasing of the 2nd and 4th order moments. Thus, we must have U’ and U’’’ > 0, with U’’ and U’’’’ < 0.
In the financial analysis, the interpretation and the judgement of these conditions can be easily done. The investors certainly show preference for assets and portfolios with high return (U’ > 0), and they show aversion towards the risk measured by the volatility of the returns (U’’ < 0).
In the same way, the investors appreciate the skewness while it is positive (U’’’ > 0): in this case, very important gains are relatively frequent as the returns distribution is rightly biased (towards high return rates). Oppositely, the investors are reluctant to exposing to negative skewness: thus, the probability distribution of the returns is not only asymmetric but moreover it is biased towards negative returns. Therefore, we can say that, frequently enough, the investors expose themselves to suffering very important losses.
Finally, the investors show a general aversion to risk. The risk can be measured by the volatility of the return rates of stocks and portfolios. But it can also be measured by the kurtosis: the leptokurtic returns allow the investor to obtain frequently very important gains and, in the same time, they expose him as frequently to suffer very important losses (U’’’’ < 0).
Consequently, it seems relevant to ask oneself on the role that the high order moments can play in the determination of the risk premia. Thus, the risk wouldn’t be reduced to the single volatility of the returns, but could be expressed by the negativity of the skewness and by the excess of the kurtosis, the last ones contributing to the new systematic risks. Therefore, the differentials of the risks premia and of the Sharpe’s ratios revealed on the European stock markets as a whole could translate only the evaluation of the others forms of risks.
III.3. The price of risk (the Sharpe’s ratio) and the two last moments
In order to measure the sensibility of the prices of risk (Sharpe’s ratios, noted RS) to the two characteristics of the risk measured by skewness (noted SK) and kurtosis (noted KU), pooling estimations were calculated for all the indexes (national and European) on annual data during the period 1996-2006.
The estimation of the equation (2) implying only the skewness, allows verifying the signification of a decreasing relationship between the price of risk and the skewness. Thus, the price of risk required by the investor values the risk inherent to a negative skewness.
![]()
Table 4: Results for the estimations of the equation 2

The Student t values are given between brackets below the value of the coefficients.
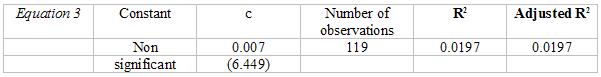
The estimation of the equation (3) allows us verifying the signification of an increasing relationship between the price of risk and the kurtosis. Thus, the price of the risk required by the investor values the risk inherent to a strong leptokurtosis.
![]()
Table 5: Results for the estimations of the equation 3
The estimation of the equation (4), introducing jointly the skewness and the kurtosis, confirm the negative effect of the skewness but leads to rejecting the influence of the kurtosis.
![]()
Table 6: Results for the estimations of the equation 4

It is possible that this result expresses the existence of collinearity between the 3rd and 4th order moments. The estimation of the relationship between these moments (equation 5) highlights the inverse relationship between skewness and kurtosis.
![]()
Table 7: Results for the estimations of the equation 5
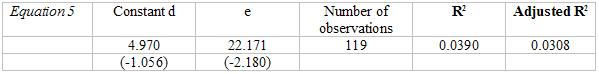
In other words, it appears that the negative values for skewness are linked to the leptokurtosis: thus, not only that the extreme values are more probable but they take the form of extreme losses implying a negative skewness. The residues of the equation (4) allowed orthogonalising the variable kurtosis.
![]()
where KU’ measures the orthogonalised (non dependent of the skewness) part of the kurtosis.
Table 8: Results for the estimations of the equation 6

The equation 6 comes back to the estimation of the relationship between the Sharpe’s ratio, on one side, and the kurtosis and skewness, on the other side. But, this time, the explanatory variable, representing the kurtosis, measures only that part of the kurtosis that is not explained by the skewness. Consequently, we find the results of the equation (4): the skewness is still the only explanatory variable of the Sharpe’s ratio. This suggests the extent of the content in information of the skewness: this one informs directly on the characteristics linked to the 3rd moment and indirectly on the characteristics of the 4th moment.
On the whole, these results reveal that the consideration of the (centred) moments of an order higher than 2 wouldn’t outdate the Sharpe’s ratio as a theoretical measure of the price of risk and as an empirical measure of the performance.
Indeed, the price of the risk contained by the Sharpe’s ratio incorporates the risks linked to the (centred) moments of an order higher than 2. More precisely, it means that the market values the negativity of the skewness through its determination by the price of risk.
CONCLUSIONS
This study allowed us to show that, in spite of the permanence of the disparities in all the characteristics of the returns linked to the national stock indexes within the Euro zone (means, standard deviations, Sharpe’s ratios, skewness and kurtosis), the integration process is working.
Consequently, the apparent differentials in the price of risk, as measured by the Sharpe’s ratio, express the rational evaluation of the risk linked to the moments of an order higher than 2.
Between the 3rd and 4th order (centred) moments, the skewness plays a strategic role due to the importance of its content in information on all the risks linked to these moments. Thus, the investor demands a higher return in exchange of a negative skewness. Doing so, he implicitly values the high probability of extreme losses.
This crucial role of the skewness allows for understanding the strategic importance of the studies on this subject and, more generally, of the studies on the risk of markets’ fall. But, these studies reach such conclusions that the market underestimates the risk linked to the skewness and refer to the necessity of undertaking coverage against the downside risk (for example, through buying puts). On the contrary, we show that the market values the risk, and the required returns include a premium supposed to ensure the risk coverage expressed by the skewness.
BIBLIOGRAPHY
1. Artus P., (2006), Skewness, Flash, Marchés, 2 avril.
2. Athayde (de) G. M. & R. G. Flores Jr., (2000), «Introducing Higher Moments in the CAPM: Some Basic Ideas», in Advances in Quantitative Asset Management, Dunis (ed), Kluwer Academic Publishers, Springer.
3. Bacmann J.-F. & S. PAChE, (2004), «Optimal hedge Fund Style Allocation Under Higher Moments» in Intelligent Hedge Fund Investing, Schachter B. (ed), RiskBooks, London.
4. Bickel P.J., & K.A. doksum, (1977), Mathematical Statistics, Holden-Day, Inc. Oakland, California.
5. Harvey C. R., (2002), «Portfolio Selection with Higher Moments», NBER, Cambridge, MA.
6. Jarque C.M. & A.K. bera, (1980), «Efficient tests for Normalitiy, Homoskedasticity and Serial Dependance of Regressions Residuals», Economic Letters, vol. 6.
7. Jondeau E. & M. Rockinger, (2004), «Optimal Portfolio Allocation Under Higher Moments», Working Paper, Banque de France & HEC Lausanne, January.
8. Kraus A. & R. H. Litzenberger, (1976), «Skewness Preference and the Valuation of Risky Assets», Journal of Finance, vol. 31.
9. Lintner J., (1965), «The Valuation of Risk Assets and the Selection of Risky Investments in Stock Portfolios and Capital Budgets», Review of Economic and Statistics, February
10. Markowitz H., (1952), “Portfolio Selection,” Journal of Finance, vol. 7, n°. 1, March.
11. Markowitz H., (1959), Portfolio Selection: Efficient Diversification of Investment, New York, John Wiley & Sons.
12. Merton R.C., (1973), «An Intertemporal Capital Asset Pricing Model», Econometrica, vol. 41, n° 5, September.
13. Neumann von J. & O. Morgenstern (1944), Theory of Games and Economic Behaviour, Princeton, Princeton University Press.
14. Newey W. K. & K. D. West, (1987), « A Simple, Positive Semi-Definite, Heteroskedasticity and Autocorrelation Consistent Covariance Matrix », Econometrica, vol. 55.
15. Newey W. K. & K. D. West, (1994), « Automatic Lag Selection in Covariance Matrix Estimation », Review of Economic Studies, vol. 61.
16. Prakash A. J. & R M bear, (1986) « A Simplifying Performance Measure Recognizing Skewness », Financial Review, vol. 21.
17. Ranaldo A. & L. Favre, (2003), « How to Price Hedge Funds : From Two- to-Four-Moment CAPM », EDHEC-Risk, October.
18. Rubinstein M. E., (1973), « The Fundamental Theorem of Parameter-Preference Security Valuation », Journal of Financial and Quantitative Analysis, vol. 8.
19. Samuelson P. A., (1970), « A Fundamental Approximation Theory of Portfolio Analysis in Terms of Means, Variance, and Higher Moments », Review of Economic Studies, vol. 37.
20. Scott R. C & P. A. Horvath, (1980), « On The Direction of Preference for Moments of Higher Order Than The Variance », Journal of Finance, 35.
21. Sharpe W., (1963), « A simplified model for portfolio analysis », Management Science, vol. 9, n° 2, January.
22. Sharpe W., (1964), « Capital Asset Prices: A Theory of Market Equilibrium under Conditions of Risk », Journal of Finance, vol. 19, n° 3, September.
23. Sharpe W., (1966), “Mutual Fund Performance”, Journal of Business, vol. 39.
24. Sharpe W., (1994), “The Sharpe Ratio”, Journal of Portfolio Management, vol. 20, Fall.
25. Stephens A. & D. Proffit, (1991), «Performance Measurement When Return Distributions Are Nonsymmetric», Quarterly Journal of Business and Economics, vol. 30.
26. Tobin J., (1958), «Liquidity Preference as Behavior Towards Risk », Review of Economic Studies, vol. 25, n° 2, February.